Azure DevOps pipeline build with .NET for CI/CD
Published: Saturday 4 June 2022
An Azure DevOps pipeline is essential if we want to setup continous integration (CI) or continous deployment (CD) in Azure.
Before we can release our .NET application to production, we need to create a build pipeline. A build pipeline is responsible for checking out the code from a source repository, such as GitHub.
From there, it can use an agent to install NuGet, restore the NuGet packages, build the application, run unit tests and publish to an artifacts file.
The build pipeline uses a YAML file to build a list of tasks to complete the build pipeline.
In this beginners tutorial, we'll have a look at how to build a Azure DevOps pipeline for an ASP.NET Core application. We'll also have a look at some of the other options, such as environment variables.
Azure DevOps account
Before we can even think about building our application in Azure, we need to setup a Azure DevOps organization.
Checkout our "What is Azure DevOps?" guide on how to setup an organisation, a project, and the different services that are available.
From there, we can use Azure Pipelines to build our application.
Create a build pipeline
With our Azure DevOps project setup, we can go ahead and create our build pipeline. Inside our project, it's a case of going into the Pipelines section, and creating a new pipeline.
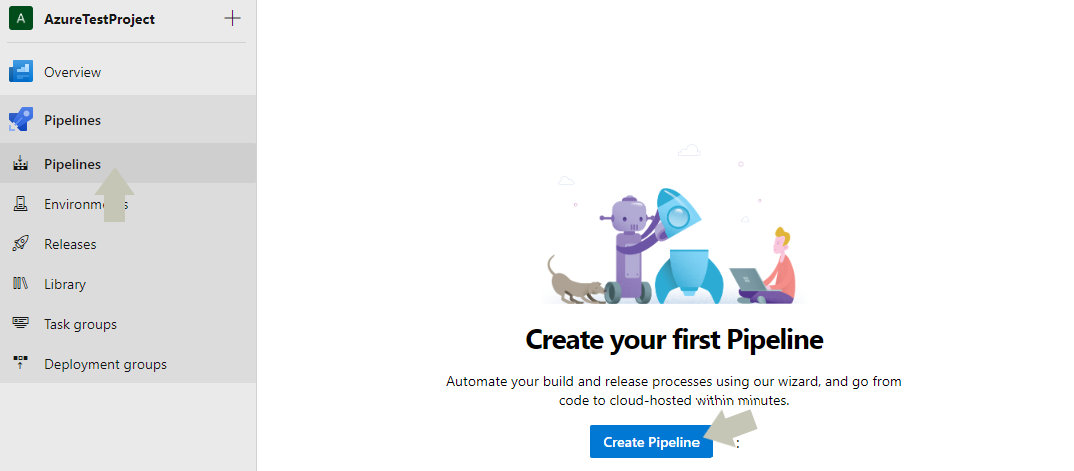
Create a Azure DevOps pipeline build
The first thing we need to do is to connect up to the source repository that hosts our ASP.NET Core application.
Azure Pipelines supports a number of external source repositories, like BitBucket and Subversion. However, for this demo, we'll going to use GitHub, and we need to login to GitHub, select the repo that we want to use and authorise it with Azure DevOps.
Once that has been complete, we're asked to configure our pipeline. There are a number of templates we can select from, and a azure-pipelines.yml file will be created and will be saved in the root of the repo.
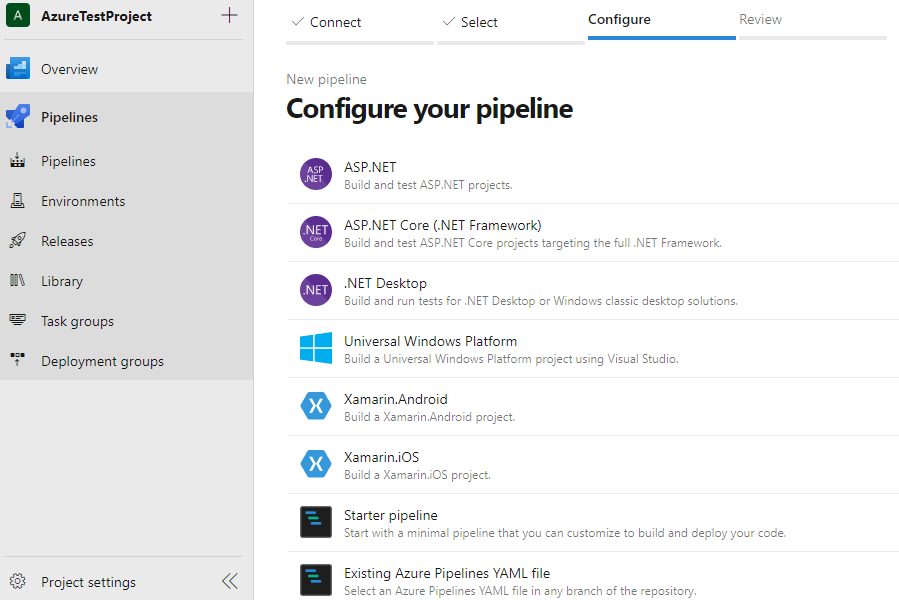
Configure a Azure DevOps pipeline
For this demo, we'll select Starter pipeline. That will take us to our azure-pipelines.yml file. We're going to go ahead and delete all the contents from the YAML file (with the exception of the comments at the top). We need some content in the file in-order to save it.
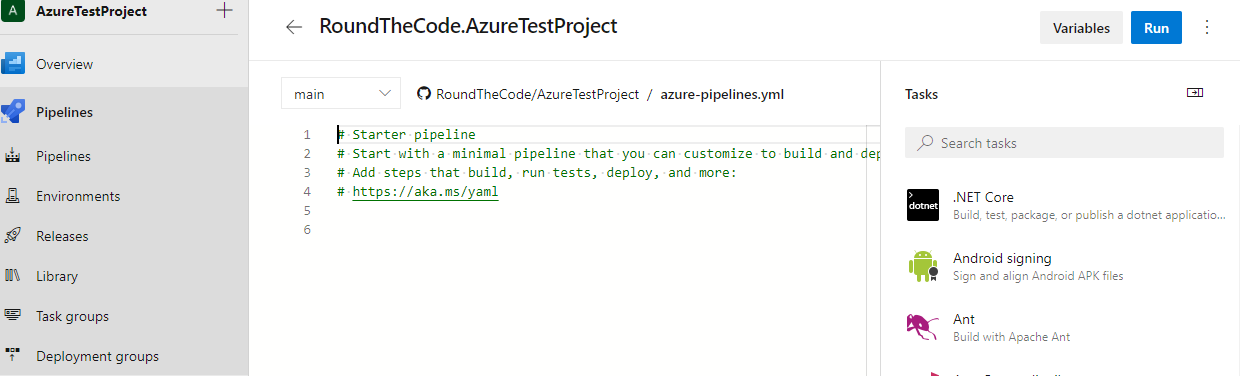
An example of azure-pipelines.yml file
Build the pipeline
We are going to have a look at a number of YAML keys that we can use to build up our pipeline and publish our application to an artifacts file.
Trigger
In-order to setup continous integration (CI), we need to setup a trigger. CI is when a build is triggered everytime a commit is made to a repo's branch.
If we wish to trigger a build everytime a commit is made into the main branch, we would add it like this.
trigger:
  branches:
    include:
      - main
However, we may wish to turn this off whilst setting up our build pipeline. The likelyhood is that everytime our YAML file is saved, it will commit to the branch that we are triggering. As a result, it will create a new instance of our build pipeline everytime the file is saved.
We can turn it off using this YAML line.
trigger:
- none
Pool
Next, we need to select an agent that will use a virtual machine image to run our build pipeline. Azure have a number of agents available which are available on the Microsoft website.
As we are using a .NET 6 application, we can use windows-latest as the virtual machine image.
pool:
  vmImage: 'windows-latest'
Variables
Afterwards, we want to think about declaring variables. This is particuarly beneficial if we are using the same values for multiple tasks within our pipeline, such as environment variables.
We can add variables by using the variables key.
variables:
  buildPlatform: 'Any CPU'
  buildConfiguration: 'Release'
  solution: '**/RoundTheCode.AzureTestProject.sln'
  project: '**/RoundTheCode.AzureTestProject.csproj'
Steps
We want to concentrate on adding tasks to our YAML file. Each task needs to be added inside a steps key, so we need to add that first into our YAML file.
steps:NuGet installer
The likelyhood is that we have NuGet packages that act as dependencies of the application. As a result, we need to install NuGet onto the virtual machine agent.
- task: NuGetToolInstaller@1
  name: 'NuGetToolInstaller'
  displayName: 'NuGet tool installer'
Restore NuGet packages
With NuGet installed, we can go ahead and restore the packages onto our virtual machine agent. Inside this task, we have a inputs:restoreSolution key. We want to set this to the Visual Studio solution file. As we set the solution file as a variable, we can reference that variable by calling $(solution).
- task: NuGetCommand@2
  name: 'NuGetRestore'
  displayName: 'NuGet restore packages'
  inputs:
    command: 'restore'
    restoreSolution: '$(solution)'
    feedsToUse: 'select'
Run unit tests
At this stage, we could go ahead and build our application. However, as we are running unit tests, the application will have to build successfully before we can run the unit tests.
For this task, we can use the .NET Core CLI. Running a command of test, and passing in a --configuration argument allows us to run the unit tests.
In our variables we set our buildConfiguration to release, so we can now use this in our task by calling $(BuildConfiguration).
- task: DotNetCoreCLI@2
  name: 'Tests'
  displayName: 'Run tests'
  inputs:
    command: 'test'
    projects: '$(solution)'
    arguments: '--configuration $(BuildConfiguration)'
Publish the application
With the tests successful, we can go ahead and publish the application.
Once again, we can use the .NET Core CLI. But this time, we will use the publish command.
We also need to add a parameter to our argument. The --output parameter tells us where to deploy the application to.
For this, we want to publish it to the artifact staging directory. This is the location that we'll use to publish the artifacts file to Azure Pipelines. The $(Build.ArtifactStagingDirectory) is a variable that will output the artifact staging directory, so we can use this in our --output parameter.
In-addition, we also need to use the inputs:projects key to state which solution or project we want to build. If we state a project, and our solution has two or more projects in it, we need to set inputs:publishWebProjects to false. Otherwise it will ignore the value in the input:projects key, and it will just find the first project that it comes across.
As we stored the project as a variable, we can reference it by calling $(project).
- task: DotNetCoreCLI@2
  name: 'Publish'
  displayName: 'Publish'
  inputs:
    command: 'publish'
    publishWebProjects: false
    projects: '$(project)'
    arguments: '--configuration $(BuildConfiguration) --output $(Build.ArtifactStagingDirectory)'
    zipAfterPublish: false
Publish build artifacts
With the web application published to the artifact staging directory, it's a case of publishing the build artifacts to Azure Pipelines. The artifacts can be used for the release pipeline, so this will be the final task that we run in the build pipeline.
- task: PublishBuildArtifacts@1
  name: 'PublishBuildArtifacts'
  displayName: 'Publish build artifacts'
  inputs:
    PathtoPublish: '$(Build.ArtifactStagingDirectory)'
    ArtifactName: 'AzureTestProject'
    publishLocation: 'Container'
The full YAML file
Here is the full YAML file for our build pipeline.
trigger:
- none

pool:
  vmImage: 'windows-latest'

variables:
  buildPlatform: 'Any CPU'
  buildConfiguration: 'Release'
  solution: '**/RoundTheCode.AzureTestProject.sln'
  project: '**/RoundTheCode.AzureTestProject.csproj'

steps:
- task: NuGetToolInstaller@1
  name: 'NuGetToolInstaller'
  displayName: 'NuGet tool installer'

- task: NuGetCommand@2
  name: 'NuGetRestore'
  displayName: 'NuGet restore packages'
  inputs:
    command: 'restore'
    restoreSolution: '$(solution)'
    feedsToUse: 'select'

- task: DotNetCoreCLI@2
  name: 'Tests'
  displayName: 'Run tests'
  inputs:
    command: 'test'
    projects: '$(solution)'
    arguments: '--configuration $(BuildConfiguration)'

- task: DotNetCoreCLI@2
  name: 'Publish'
  displayName: 'Publish'
  inputs:
    command: 'publish'
    publishWebProjects: false
    projects: '$(project)'
    arguments: '--configuration $(BuildConfiguration) --output $(Build.ArtifactStagingDirectory)'
    zipAfterPublish: false

- task: PublishBuildArtifacts@1
  name: 'PublishBuildArtifacts'
  displayName: 'Publish build artifacts'
  inputs:
    PathtoPublish: '$(Build.ArtifactStagingDirectory)'
    ArtifactName: 'AzureTestProject'
    publishLocation: 'Container'
Just a note that YAML has a strict structure to it. Using tabs can lead to unpredictable results, and indenting is required when calling child keys.
Azure Pipelines will validate and display any warnings or errors if there are any issues with the YAML file.
Running the build pipeline
With the build pipeline built, we can go ahead and run it. We can go ahead and press the blue "Run" button in the top-right hand corner of the screen.
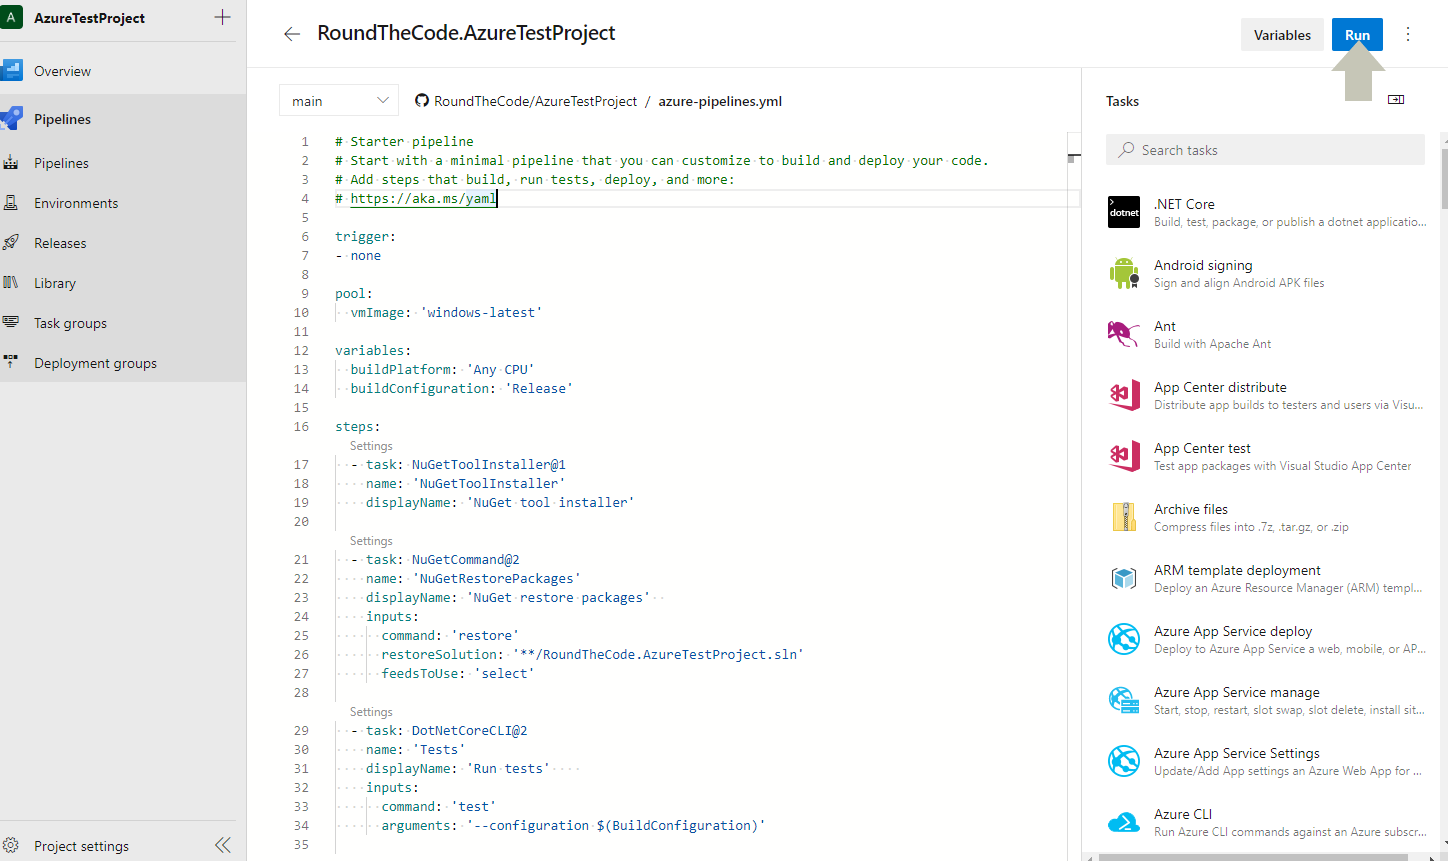
Run a build pipeline in Azure Pipelines
This will run the tasks in our build pipeline. Assuming the build pipeline ran successfully, there will be a link to the artifact file in the "Job" parent task.
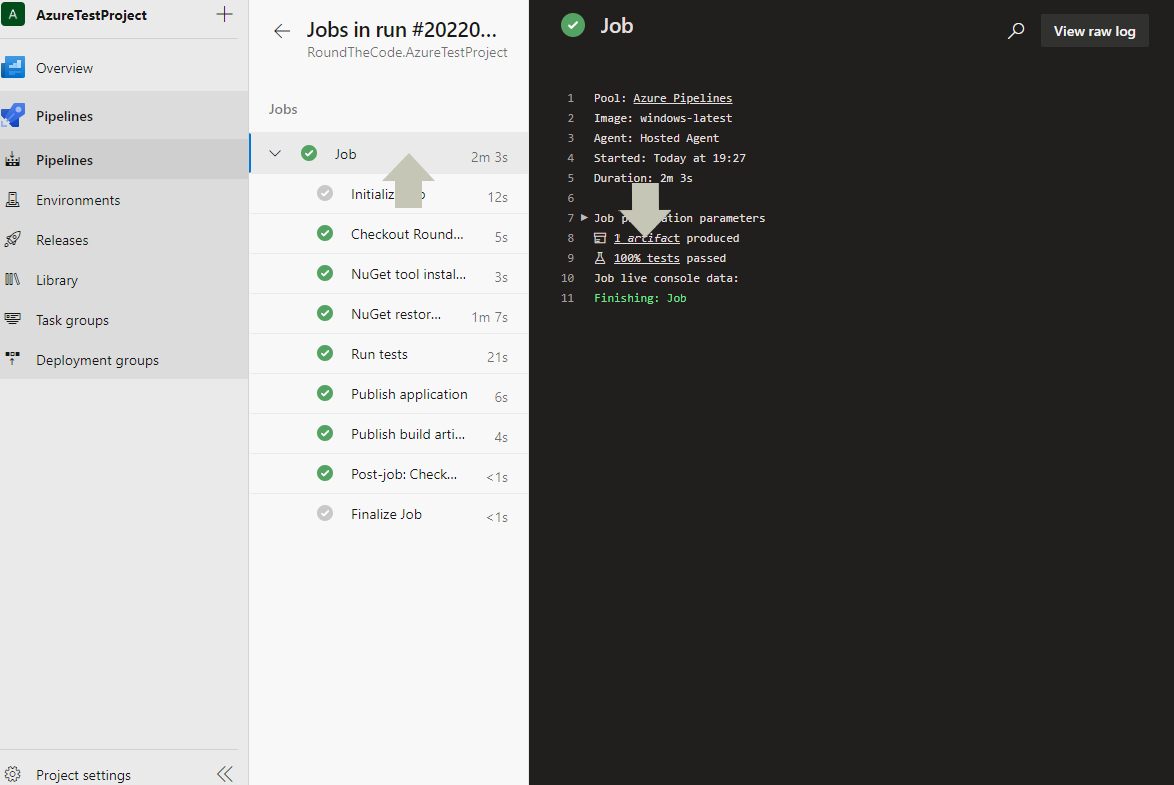
Successful build pipeline in Azure Pipelines
Clicking on the artifact file allows us to see what files were published to the build artifact. This is so we can check that we have included all the necessary ASP.NET Core files ready for release.
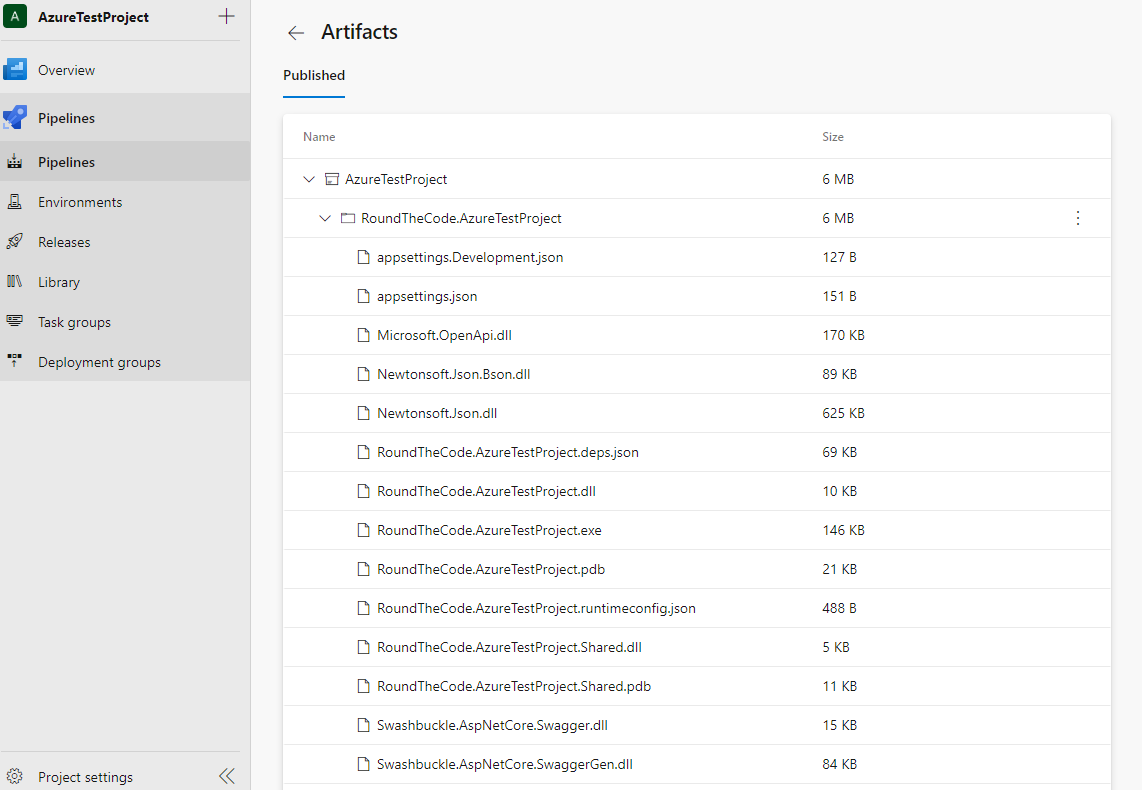
A published artifacts file example in Azure Pipelines
See the build in action
Checkout our video tutorial, where we go ahead and create a build pipeline. We populate the YAML file with our tasks, and then run it.
Also checkout the ASP.NET Core Web API project used in this tutorial. Download it and use it to create a build pipeline and run it. The Git repository will need to be forked into a Git account which can have access to the Azure DevOps project.
The release pipeline
With the build pipeline complete and with the artifacts file published to Azure Pipelines, the next steps will be to create a release pipeline.
With a release pipeline, the release servers will need to be setup with the Azure DevOps account. It will use the published artifacts file to run the release to the server.
This can be triggered automatically after a build pipeline has been completed, or it can be done manually.
Related tutorials
Azure DevOps release pipeline for .NET Web API using IIS
Build an Azure DevOps release pipeline for .NET. Setup CI/CD and deploy your Web API to IIS using YAML tutorial.